







Sooner or later, someone asks for a Business Central report “in Excel.” The request sounds simple, but there are two very different ways to deliver it. One lets Excel design the report. The other has AL code build the workbook.
They look similar from the outside, and choosing the wrong one costs rework. This guide explains how an Excel layout works, what Excel Buffer does, and how to decide between them.
QUICK ANSWER
A Business Central Excel layout is an .xlsx workbook that presents the data from a report’s dataset, so users can add formulas, PivotTables, charts and Power Query without changing the dataset. Excel Buffer is an AL table that developers use to build and write Excel workbooks through code. Use an Excel layout for analytical reports users can shape in Excel. Use Excel Buffer when code has to control the workbook.
What Is an Excel Layout in Business Central?
An Excel layout is an Excel workbook (.xlsx) that decides how the data from a Business Central report is presented. Microsoft added Excel as a report layout type in 2022 release wave 1 (BC20), alongside the Word and RDLC layouts.
The key idea is the split between data and design. The report provides the dataset, meaning the data items and columns a developer defines in AL. The Excel layout provides the presentation. Users can build formulas, PivotTables, Pivot Charts and Power Query steps in Excel, and the underlying report logic stays in Business Central.
The flow looks like this: Report, then Dataset, then Data sheet, then Presentation sheets, then Final report.
How Does an Excel Layout Work?
Every Business Central Excel layout requires a worksheet named Data containing a table named Data. The table provides the connection between the report dataset and the Excel layout. The table must start in cell A1 and can contain only columns that exist in the report dataset.
Here is what a small Customer report dataset might look like on the Data sheet:
| Customer No. | Customer Name | Address | Balance |
| 10000 | Customer A | New York | 25,000 |
| 20000 | Customer B | London | 18,500 |
| 30000 | Customer C | Sydney | 32,700 |
Sample values for illustration. From that table, you can add customer details, total balances, formulas, PivotTables, charts, and summary sheets.
The rules for the Data sheet
- Keep the sheet named Data and the table named Data.
- The Data sheet and Data table are mandatory, and their structure must stay intact.
- If the developer adds columns to the dataset later, existing layouts don’t update automatically. Run the report and choose Microsoft Excel Document (data only) on the request page to see the current column names.
Power Query and Refreshable Excel Reports
Power Query can be used within an Excel layout to clean and transform the report data; for example, changing data types, combining fields, or preparing data for analysis.
However, an Excel layout should not be confused with a live, refreshable Excel connection to Business Central. Excel layouts are rendered from the Business Central report dataset when the report runs.
If users need an Excel workbook that can refresh data directly from Business Central, a different approach may be more appropriate, such as connecting Excel to Business Central APIs or OData web services through Power Query.
How Do You Create an Excel Layout?
Microsoft documents several routes, including starting from an existing report, and creating layouts in Visual Studio Code for extension development. A practical workflow for a report author looks like this:
- Pick the report that holds the data you need, for example, the Customer List.
- Export the dataset. Run the report, and on the request, page choose Send to then Microsoft Excel Document (data only). You get the raw dataset without a finished layout.
- Design the presentation in Excel. Add sheets, formulas, tables, charts and PivotTables on top of the Data sheet.
- Add the workbook to Business Central. On the Report Layouts page, add it as an Excel layout for that report.
- Test it by running the report and choosing the new layout on the request page.
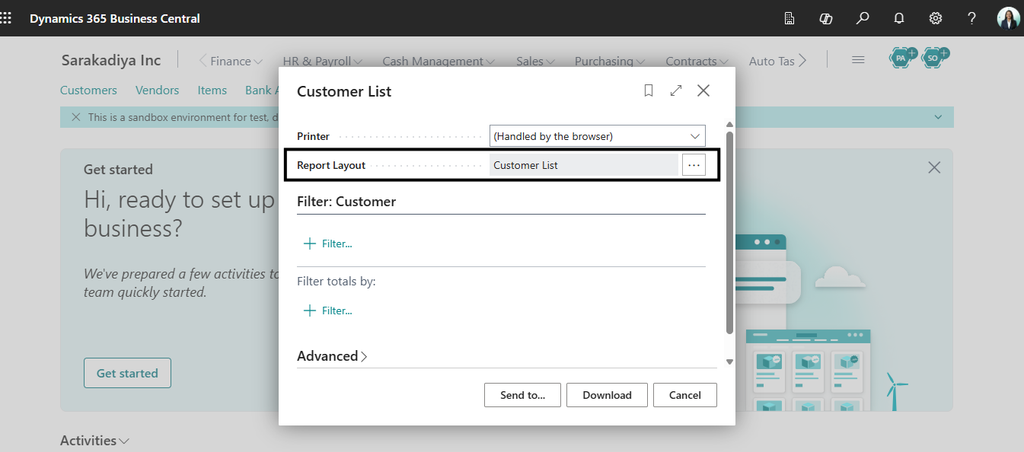
The Customer List request page in a Business Central sandbox. The Report Layout field shows the layout the report will use.
Menu names can differ slightly between versions, so follow Microsoft’s current steps for your release.
Using Power Query with an Excel Layout
Raw report data often needs tidying before people can use it. Microsoft recommends considering Power Query to clean and transform data, for example to set the correct data types. It has been available in Excel since 2016, though the connectors differ by version.
In our sandbox example, we opened the Data table in Power Query and renamed the fields before loading it to a new sheet:
- No became Customer No.
- Name became Customer Name
- Balance_LCY became Balance
Power Query also suits changing data types, combining columns and preparing data for analysis. It keeps those steps visible and repeatable, which is easier to maintain than a pile of worksheet formulas.
Building Presentation Sheets
This is where an Excel layout stops being a plain export. Keep the Data sheet as the source and build separate sheets on top:
| Sheet | Purpose |
| Data | The raw Business Central dataset. Leave its structure alone |
| Customers | A clean customer-level view, with calculations such as Total Balance |
| Summary | Totals and key figures for managers |
| Analysis | PivotTables and charts |
Separating the layers makes the workbook easier to read, and easier for the next person to change.
What Are the Benefits of Excel Layouts?
- Familiar tools. Users work with formulas, tables, PivotTables, charts and formatting they already know.
- Flexible presentation. One dataset can support several sheets and views for different audiences.
- Less AL for layout changes. The dataset may need a developer, but many presentation changes happen in Excel. Microsoft describes Excel and Word layouts as changeable without touching the dataset.
- Better analysis. PivotTables, Pivot Charts and slicers turn rows into insight.
- Data cleanup. Power Query handles transformation inside the workflow.
What Is Excel Buffer in Business Central?
Excel Buffer is an AL table used by developers to generate and work with Excel workbooks programmatically. Instead of defining the workbook’s presentation primarily through an Excel layout, AL code controls the workbook structure, worksheets, rows, columns and cell content.
The basic flow uses methods such as CreateNewBook, NewRow, AddColumn, WriteSheet, CloseBook and OpenExcel:
TempExcelBuffer.CreateNewBook(‘Customers’);
// …fill the buffer with NewRow and AddColumn…
TempExcelBuffer.WriteSheet(‘Customers’, CompanyName(), UserId());
TempExcelBuffer.CloseBook();
TempExcelBuffer.OpenExcel();
That control suits cases where the workbook is part of the application logic: generating files dynamically, writing to specific worksheets and cells, or producing a custom export as part of a business process.
Excel Layout vs Excel Buffer: What Is the Difference?
The biggest difference is where the control sits. With an Excel layout, the report dataset comes from Business Central and Excel handles the presentation. With Excel Buffer, AL code creates and shapes the workbook.
| Area | Excel layout | Excel Buffer |
| Main purpose | Report presentation and analysis | Programmatic Excel generation |
| Main tool | Microsoft Excel | AL code |
| Data source | A Business Central report dataset | Data supplied through AL logic |
| Who controls the design | Mostly the layout author in Excel | Mostly the developer in code |
| PivotTables and charts | A natural fit | Harder. Not what it is designed for |
| Power Query | Can be used | Not its purpose |
| Best for | Analytical, user-facing reports | Custom exports and generated workbooks |
They aren’t direct replacements. Each answers a different requirement. For quick exports of a list page, the built-in Open in Excel action is often enough, so check that before building anything.
Before Building a Custom Excel Report
If users simply need to analyze data from a Business Central list, first check whether Open in Excel or the available analysis capabilities already meet the requirement. A custom Excel layout or AL-generated workbook is more appropriate when you need a predefined report structure, custom calculations, specialized presentation, or application-driven workbook generation.
When Should You Use Each?
Choose an Excel layout when:
- A report dataset already exists or can be built
- Users want to work with the report in Excel
- The report needs PivotTables or charts
- Business users should be able to adjust the presentation
- You want several Excel views of the same data
Choose Excel Buffer when:
- AL code has to generate the workbook dynamically
- Excel creation is part of a custom process
- You need detailed control over worksheets and cells
- The output doesn’t fit a standard report dataset
A simple test: do you need to design a report experience in Excel, or do you need Business Central to build a workbook through code? The answer usually settles it. record again to confirm.
Best Practices and Common Mistakes
- Keep the Data sheet intact. Name, table and columns stay as they are.
- Keep raw data separate from presentation sheets.
- Test the dataset first with the data-only export before you design the final layout.
- Use Power Query for cleanup instead of long chains of formulas.
- Update layouts after dataset changes. New columns don’t appear in existing layouts on their own.
- Don’t use Excel Buffer by default. If a layout can do the job, it usually needs less code to maintain.
How This Guide Was Verified
We reviewed this guide against Microsoft Learn’s documentation on Excel layout reports, report datasets, the Excel Buffer table and the 2023 release wave 2 Excel layout updates on September 29, 2026. The Customer List example was built in a Business Central sandbox. Menu names and features can differ by version, so confirm details for your release.
How Sarakadiya Can Help
Sarakadiya is a Microsoft Dynamics 365 and Business Central-focused technology partner. We help businesses with reporting, custom AL development and Business Central customization, and can help you choose between a layout and a code-built export. If you want a second opinion on your setup, see our Business Central services.
Key Takeaways
- An Excel layout separates the report dataset from its Excel presentation.
- Keep the Data sheet and Data table structure compatible with the report dataset. Don’t rename dataset columns or add columns that aren’t part of the dataset.
- Power Query, PivotTables and charts make layouts strong for analysis.
- Excel Buffer is for building workbooks through AL code.
- Pick based on the requirement: designed in Excel, or generated by code.